Credit unions serve the financial needs of members and communities of all incomes. To provide further incentives for credit unions to serve lower-income members and communities, Congress and the National Credit Union Administration (NCUA) have developed legislation and regulation (1) that identify some credit unions as low-income designated (LID) and (2) that provide several benefits (i.e., regulatory relief and funding) for LID credit unions.
To help credit unions assess whether they quality for a low-income designation, the NCUA maintains, and updates, a Low-Income Designated Area Workbook which lists counties, census tracts, and census block groups where over 50% of residents either “have a family income of 80 percent or less than the median family income for the metropolitan area where they live or national metropolitan area, whichever is greater, or those members who earn 80 percent or less than the total median earnings for individuals for the metropolitan area where they live or national metropolitan area, whichever is greater.” The main way a credit union can obtain and maintain its LID status is by showing that more than 50% of its members live in LID qualifying counties, census tracts, or census block groups.
The benefits of being a LID credit union include:
- Authority to obtain supplemental capital (e.g., subordinated debt). Additional capital can both buttress financial solidity and accommodate larger deposit inflows.
- Ability to accept non-member deposits from any source (i.e., in addition to deposits from government organizations). The ability to accept non-member deposits can be particularly useful during mergers with credit unions and banks where all members and clients of the merging institutions do not readily fall within the field of membership of the continuing institution.
- An exemption from the statutory cap on member business lending, which expands access to capital for small businesses and helps credit unions to diversify their loan portfolios.
- Eligibility for grants and low-interest loans from the NCUA’s Community Development Revolving Loan Fund (CDRLF), particularly for smaller institutions.
- Special field of membership provisions for federal community and multiple common bond credit unions.
NCUA LID Area Workbook Update: Key Nationwide Changes for Credit Unions
NCUA’s most recent LID Area Workbook (released in 2025) is based on the U.S. Census Bureau’s 2023 American Community Survey (ACS) 5-year data and updates the previous workbook (released in 2024) which was based on 2022 ACS 5-year data. In figure 1, we sum the population in each county, census tract, and census block group identified by the NCUA as LID using 2022 and 2023 ACS 5-year data.
From 2022 to 2023, the number of US residents in LID qualifying geographies increased by 12.6 million, from 193.7 million to 206.2 million. At the same time, the percentage of the US population in LID qualifying areas increased by 3.9 percentage points, from 57.6% to 61.5%. Credit unions interested in seeking or maintaining their LID status may target new member outreach efforts toward the parts of their geographic fields of membership that are LID qualifying, including those that are newly LID qualifying.
Figure 1: Population in counties, census tracts, and census block groups identified by NCUA as LID, using 2022 and 2023 census data (in the 2024 and 2025 LID Area Workbooks)
Sources: NCUA LID Area Workbook (2024 and 2025) and U.S. Census (2025).
NCUA LID Workbook Update: State-by-State Impacts on Credit Union Eligibility
Credit unions interested in seeking or maintaining their LID status can, of course, do so more readily in parts of the country with more LID qualifying areas. Figure 2 presents total and LID qualifying population, across states (and other US jurisdictions) in 2022 and 2023.
Figure 2: LID qualifying population: total and % of total population, 2022 and 2023
Figure 3 highlights LID qualifying population as a percentage of total population, in descending order across states. The figure highlights that LID qualifying populations are higher in parts of the country with lower per capita incomes, such as Puerto Rico and the South, and are lower in higher income areas, such as the Northeast and Midwest. Other than Puerto Rico, where 100% of residents live in LID qualifying geographies, the highest percentage residing in LID qualifying areas was in West Virginia (85.3%) and the lowest was in Connecticut (41.9%).
Figure 3: LID qualifying population (% of total population, across states, ranked, 2023)
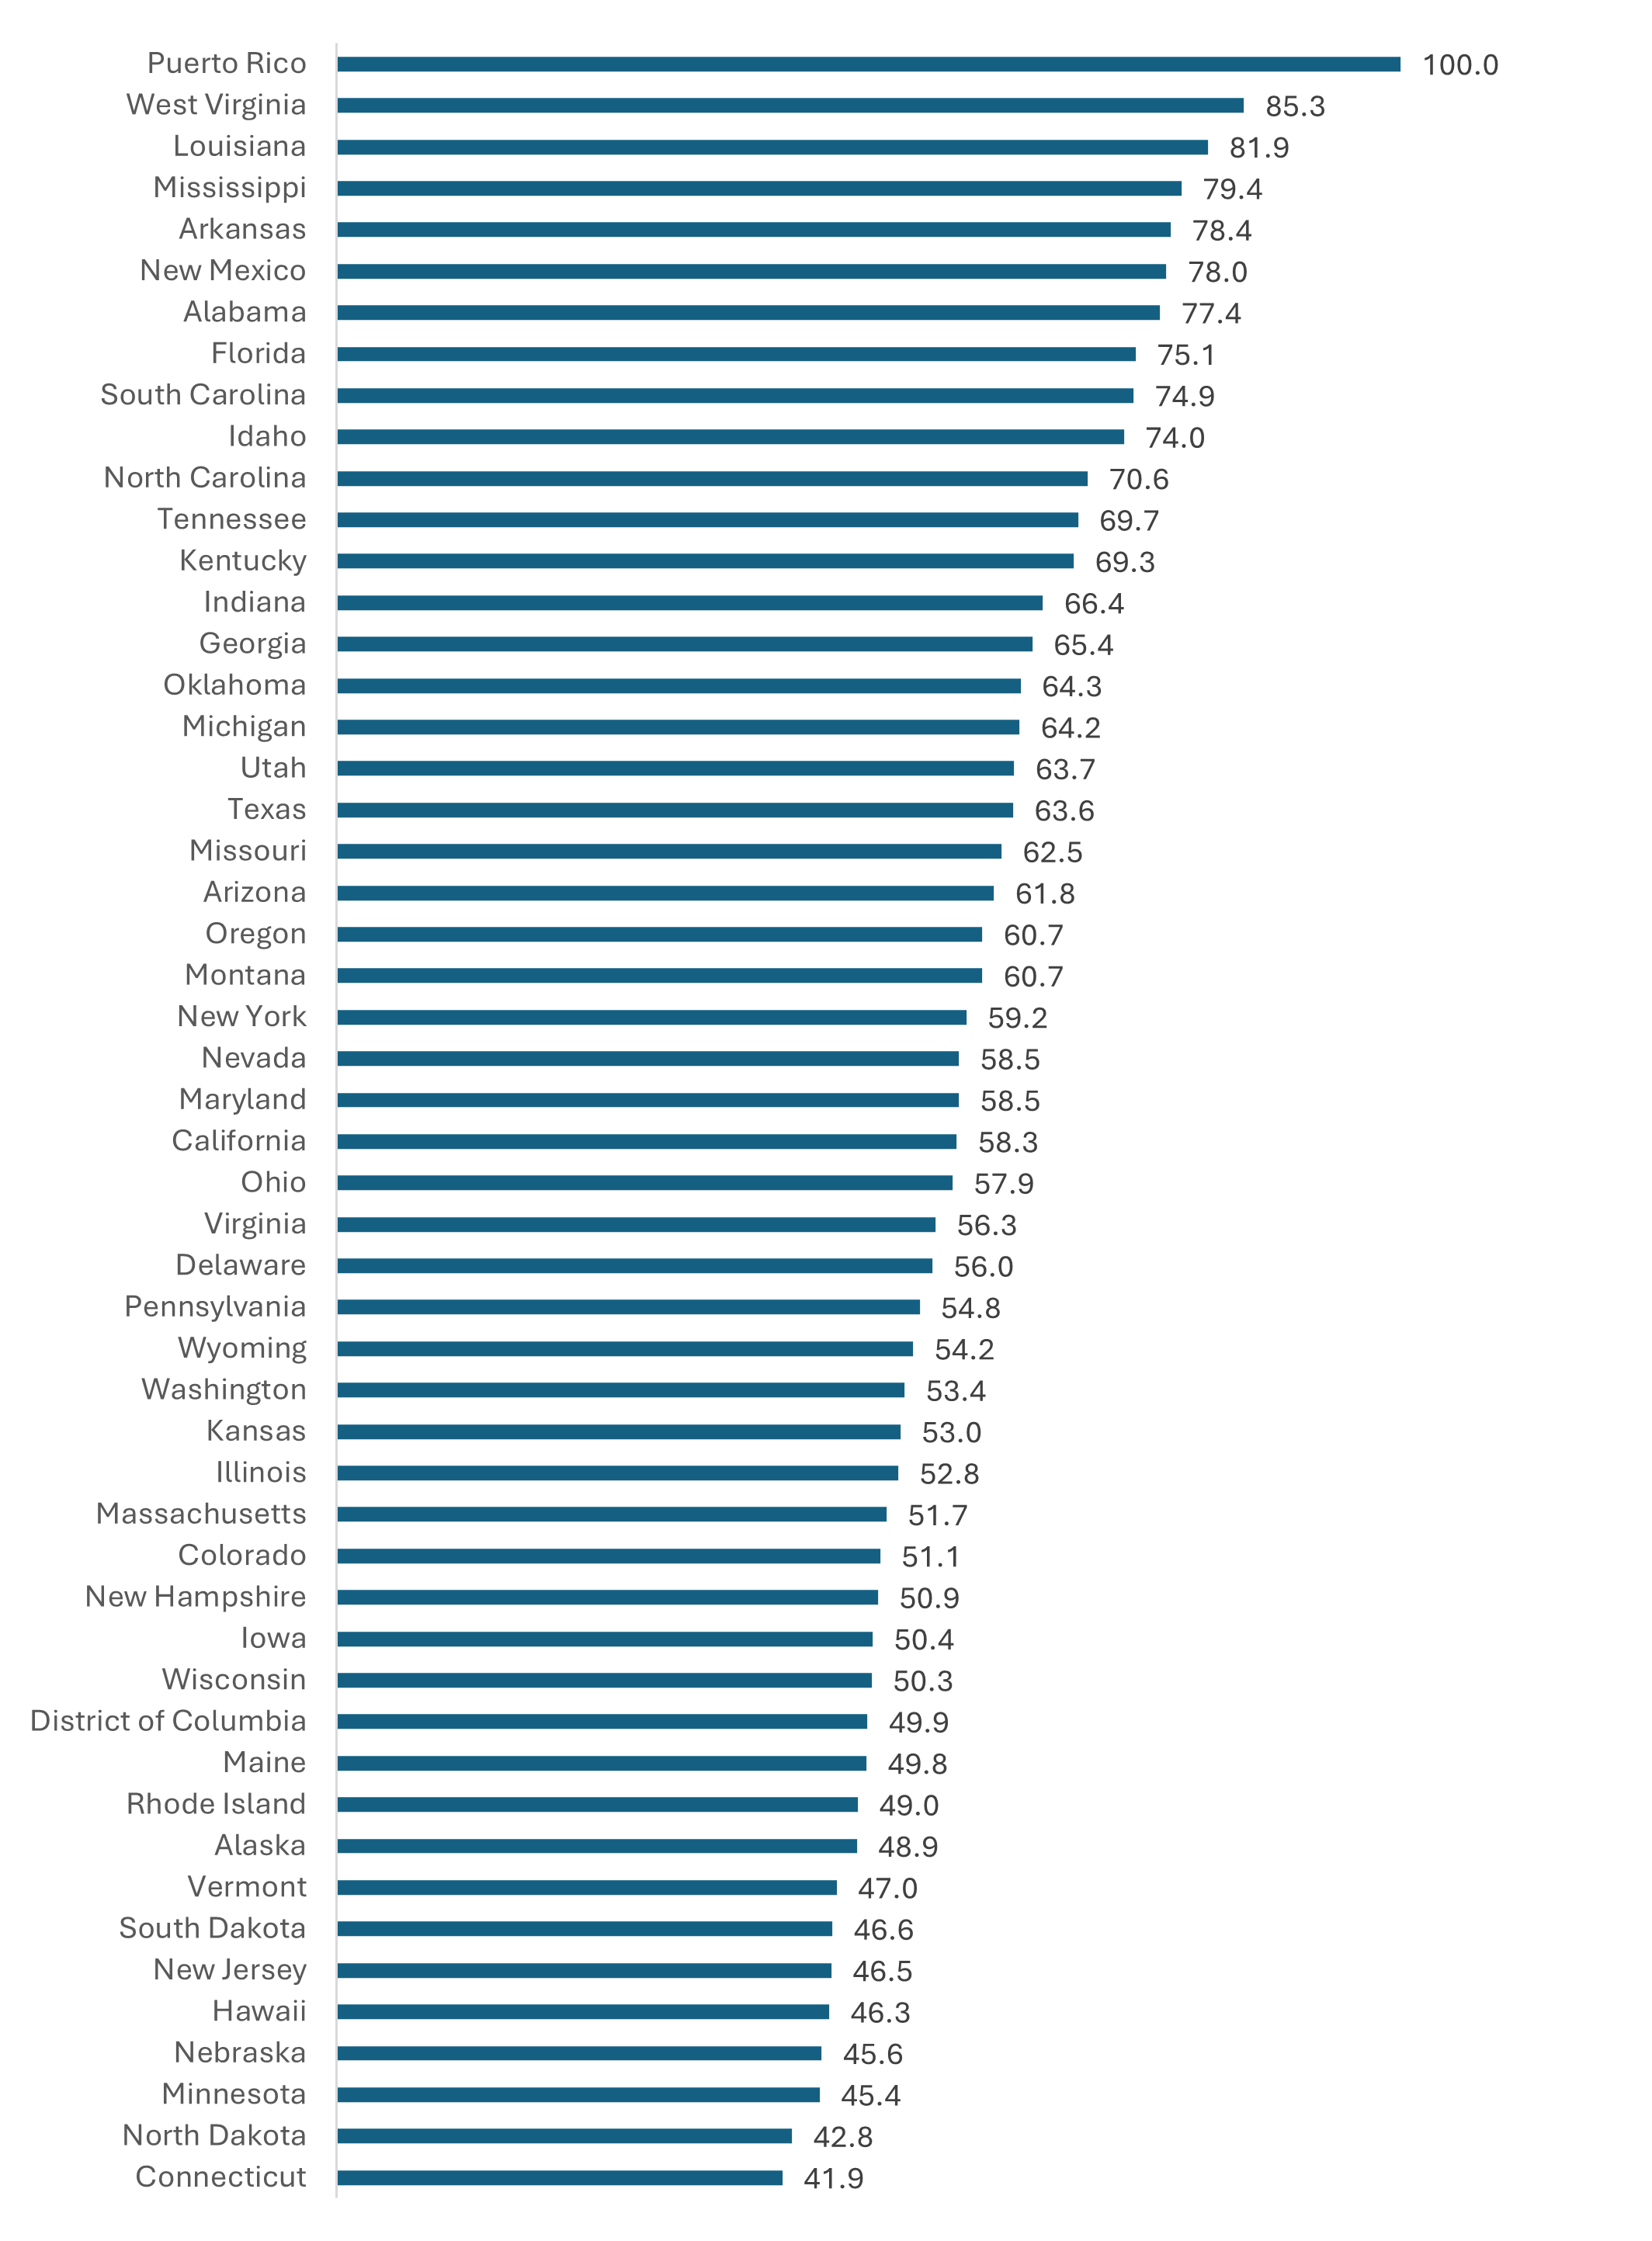
Figure 4 presents the change in the percentage of LID qualifying populations across states during 2022-2023. (Figure 5 presents the same data, in map form.) The fraction increased for every jurisdiction, except Puerto Rico, where it was 100% in both years. The largest increase took place in Tennessee (7.9), but most of the largest increases took place in states that were otherwise high income and that had lower percentages of LID qualifying geographies. For instance, Connecticut saw its LID fraction increase from 34.4% to 41.9% or by 7.5 percentage points. Maine, Vermont, Alaska, and New Hampshire are other states also with low LID fractions that saw among the largest increases in their LID fractions. Credit unions interested in seeking and maintaining their LID status should pay special attention to geographies where LID qualifying fractions increased the most.
Figure 4: Change in % in LID qualifying population, across states, ranked, 2022-2023
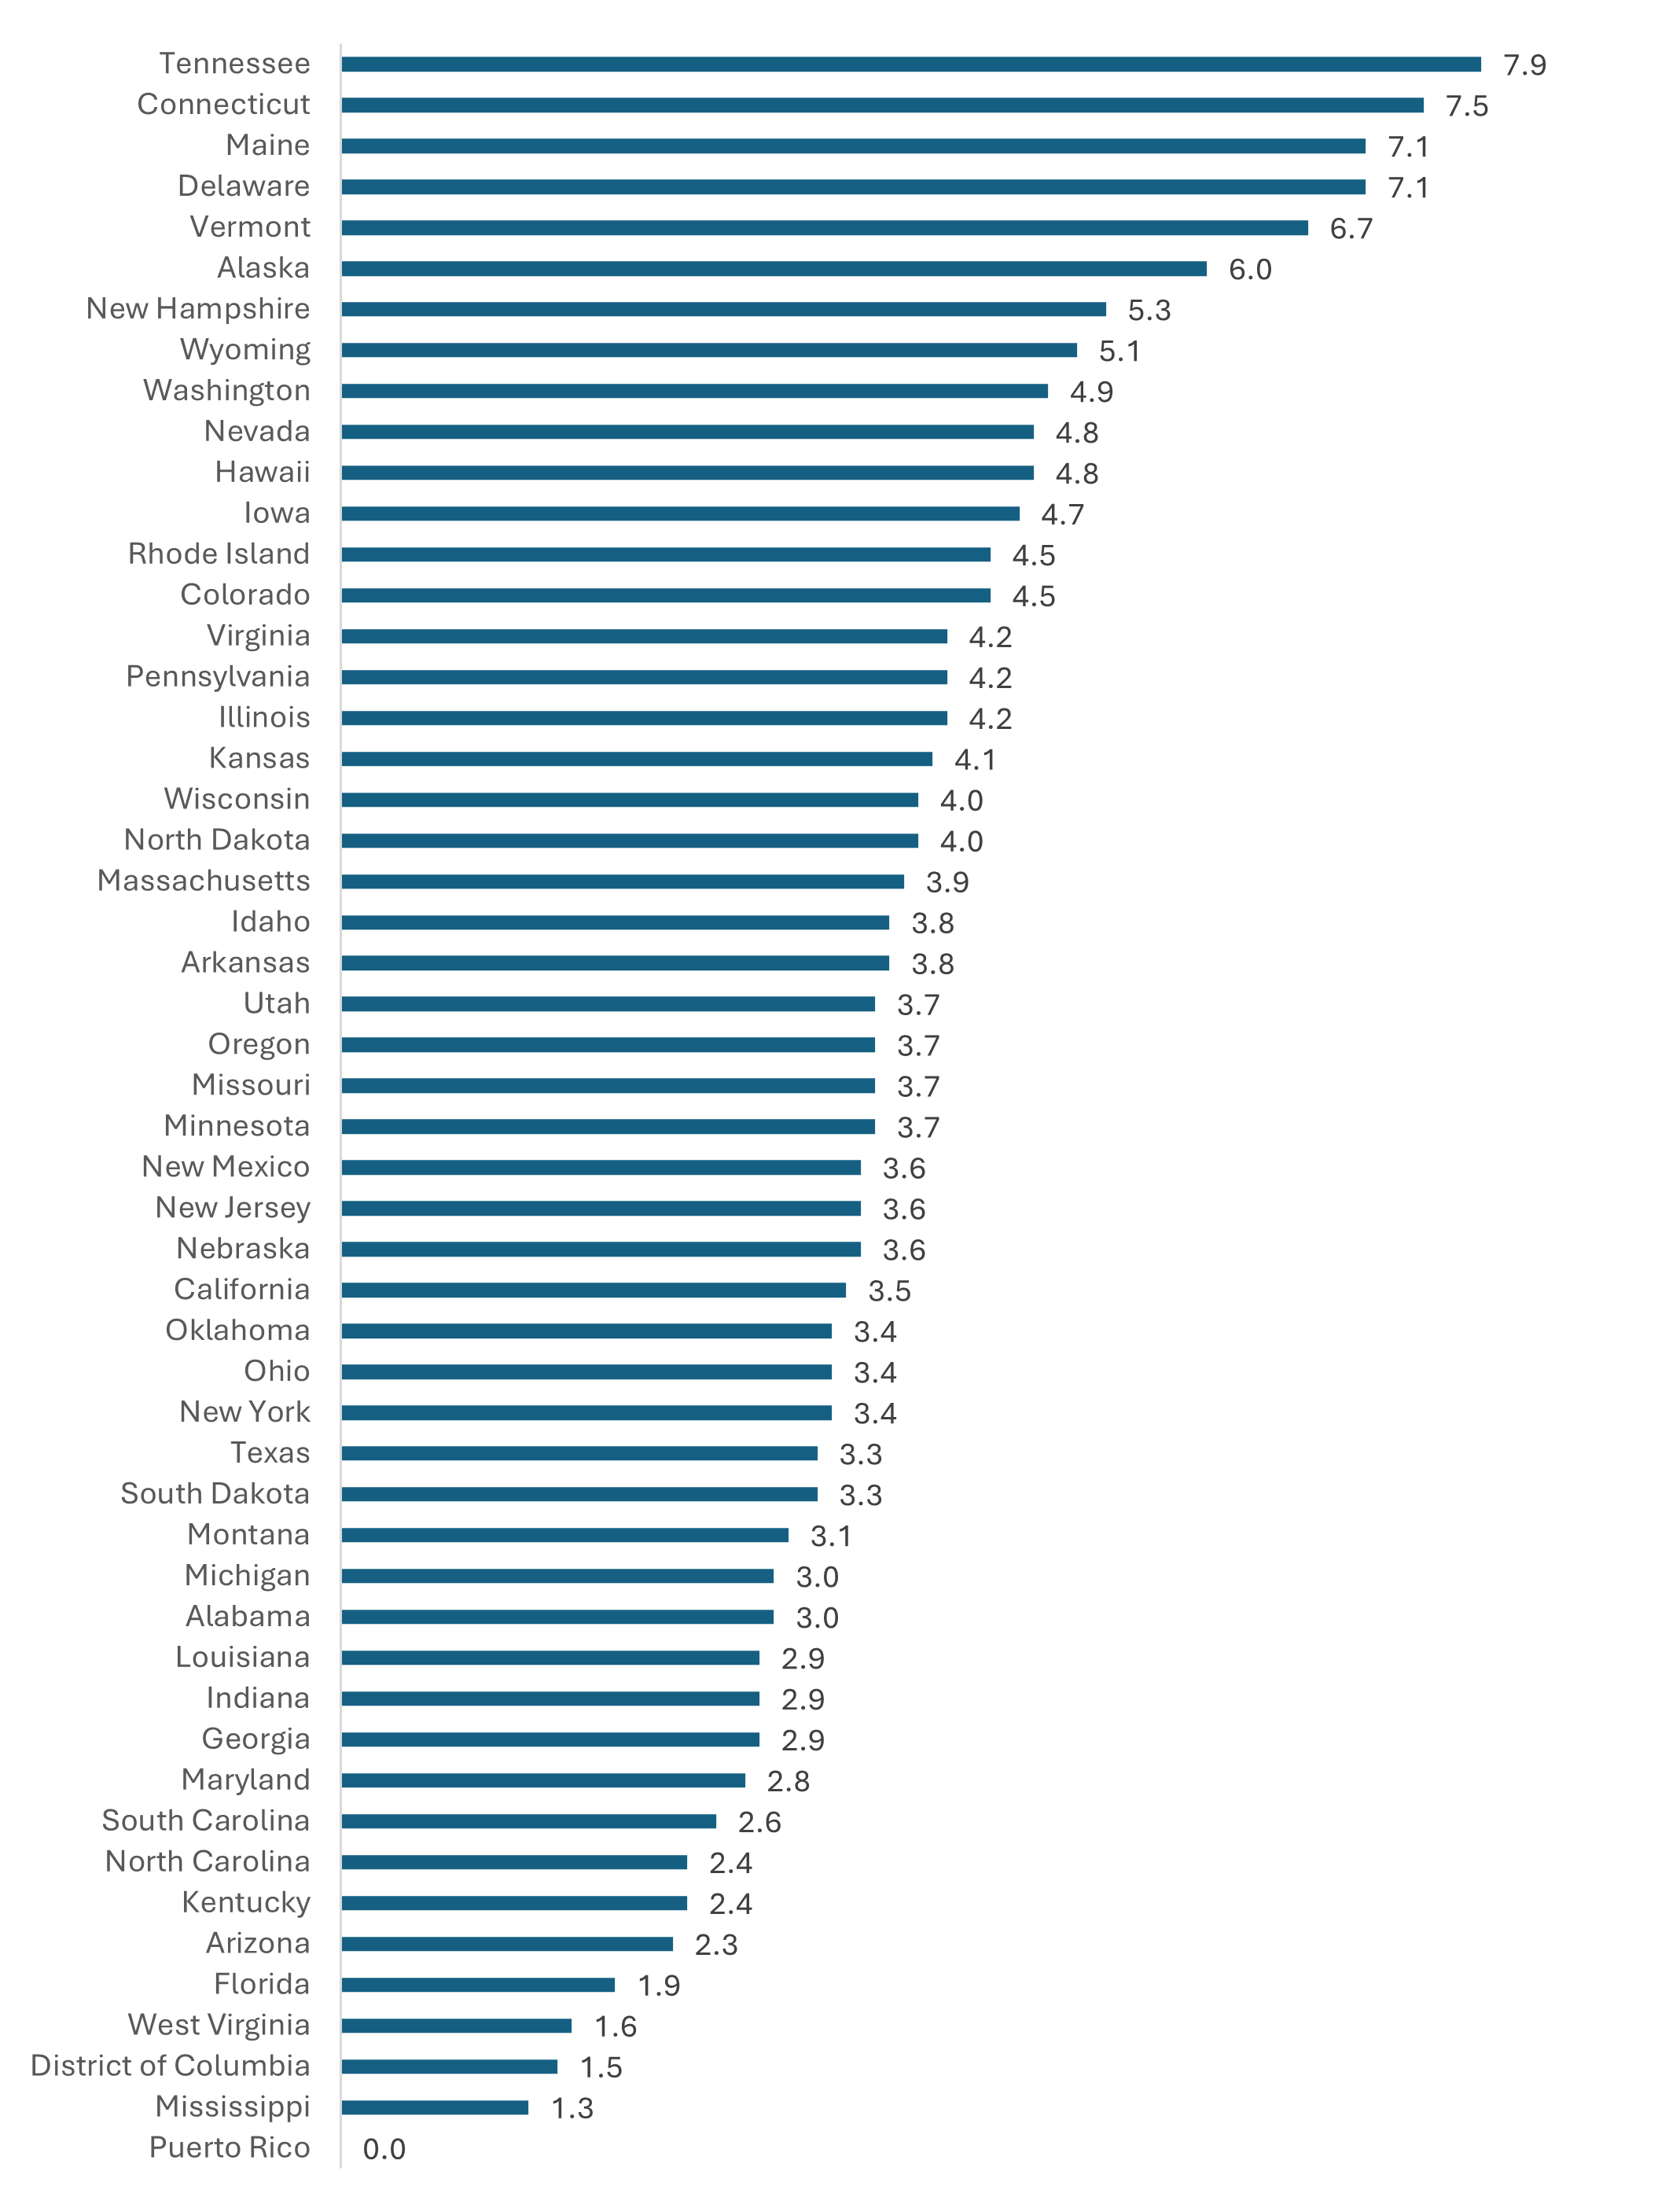
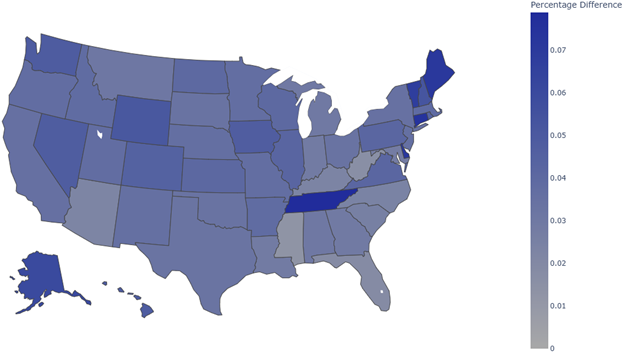
Figure 5 presents a map showing the change in the percentage of LID qualifying population across states from 2022 to 2023.
Figure 5: Map of changes in % of LID qualifying population, across states, 2022-2023
The next set of maps show the specific areas that were LID qualifying in 2022 and 2023, and thus the resulting changes, for the six states with the largest changes: Tennessee, Connecticut, Maine, Delaware, Vermont, and Alaska. Credit unions interested in seeking or maintaining their LID status that have operations, or are interested in operations, in those states should pay special attention to the areas that have recently become LID qualifying.
Finally, some of the largest increases in the number of LID qualifying residents are in states with either large increases in their LID fraction or in states with large total populations. For instance, the number of LID qualifying residents grew by 1.2 million in Tennessee (out of a total population of 7.0 million) and by 1.3 million in California (out of a total population of 39 million).
Figure 6: LID qualifying areas in Tennessee: 2022 vs. 2023
2022: 61.9%
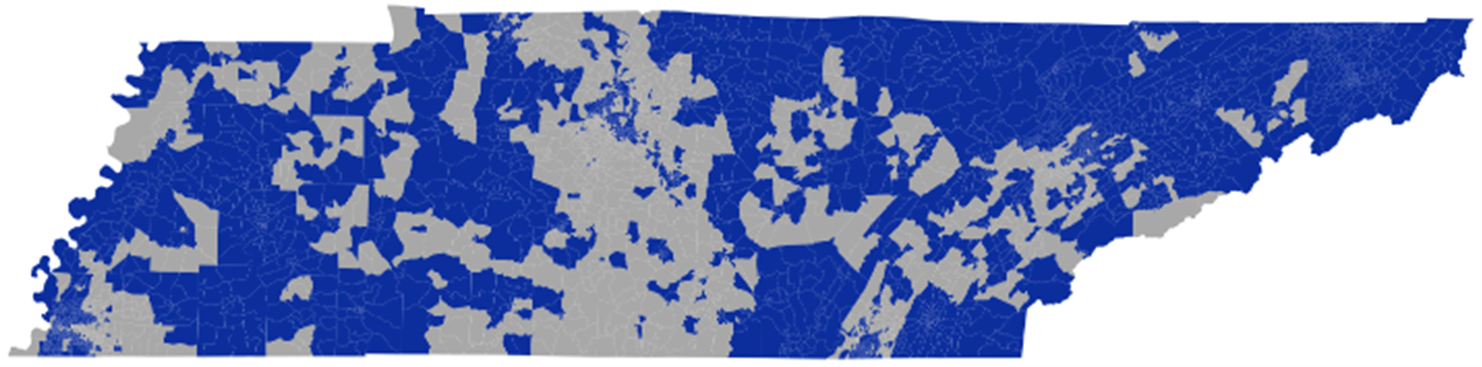
2023: 69.7%
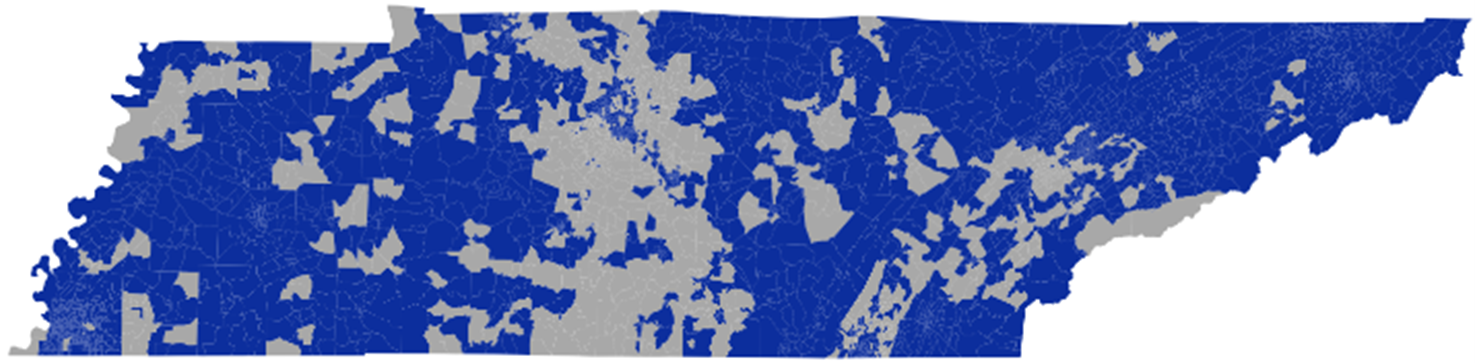
Figure 7: LID qualifying areas in Connecticut: 2022 vs. 2023
2022: 34.4%
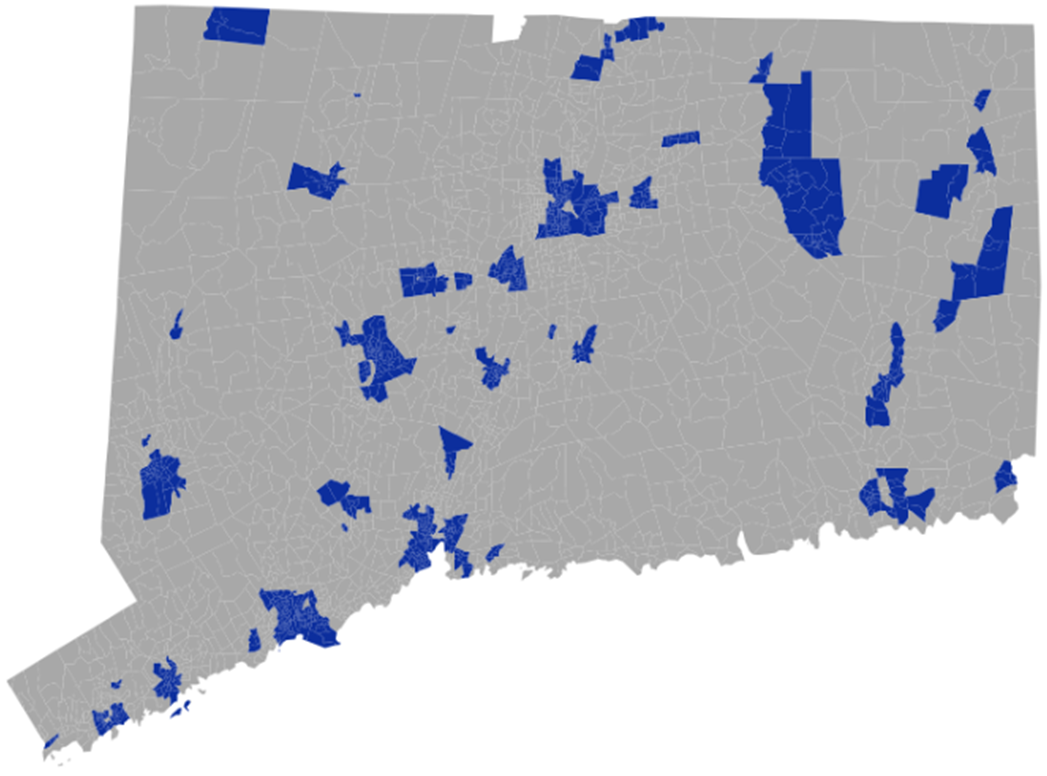
2023: 41.9%
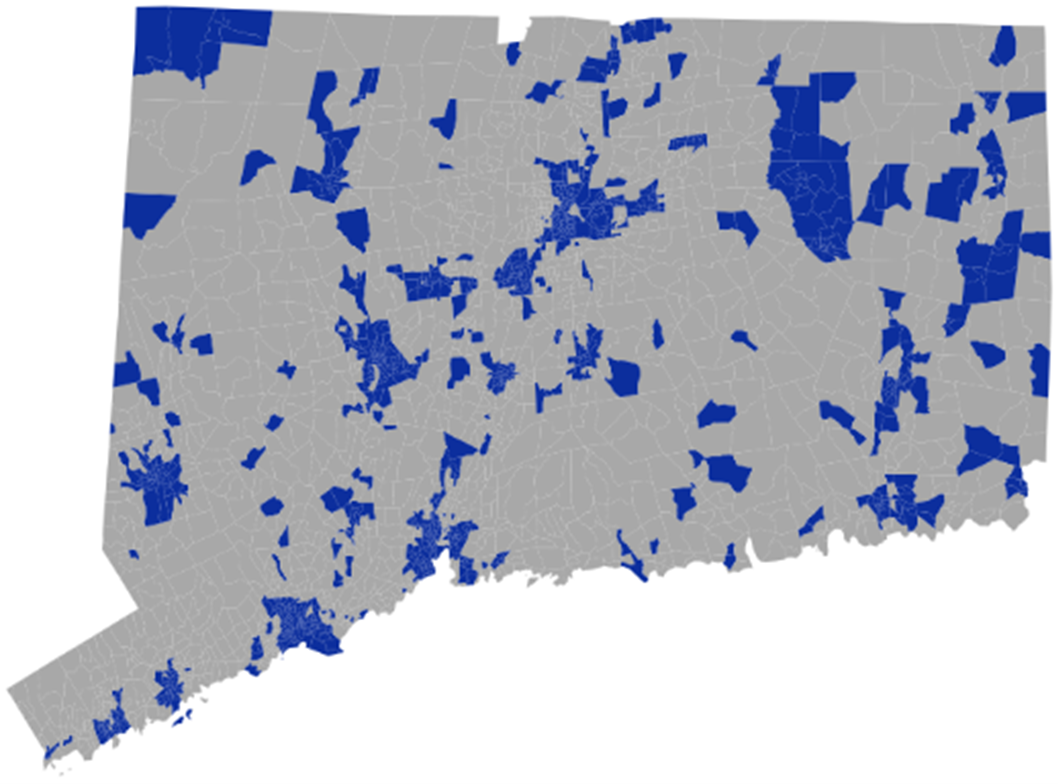
Figure 8: LID qualifying areas in Maine: 2022 vs. 2023
2022: 42.7%
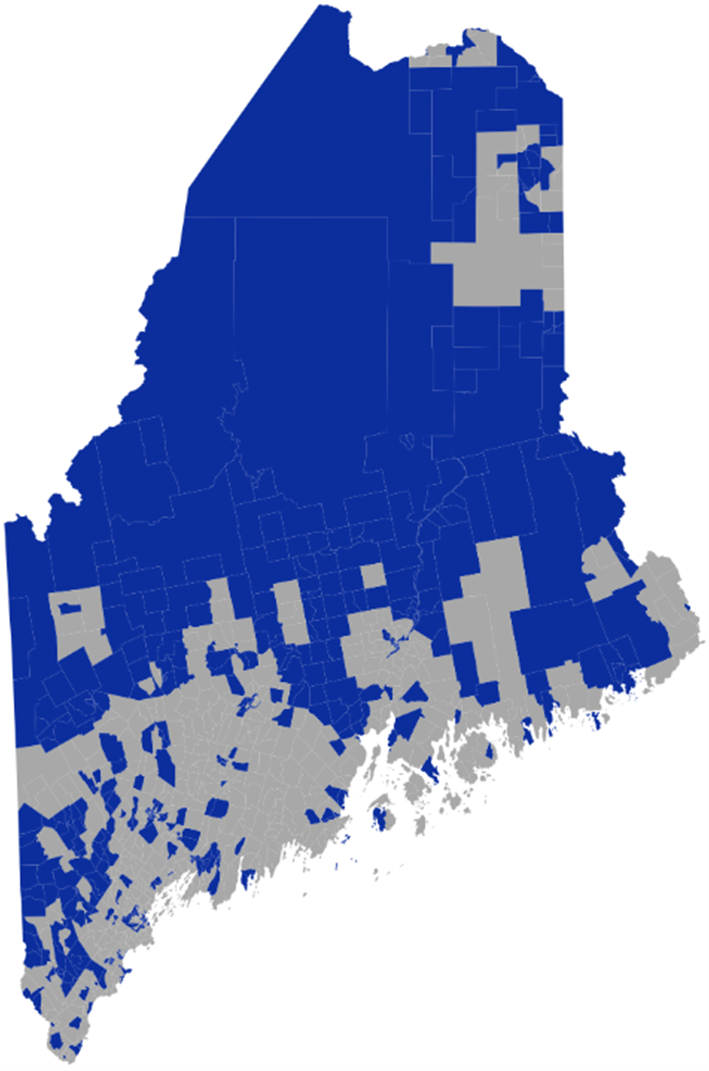
2023: 49.8%
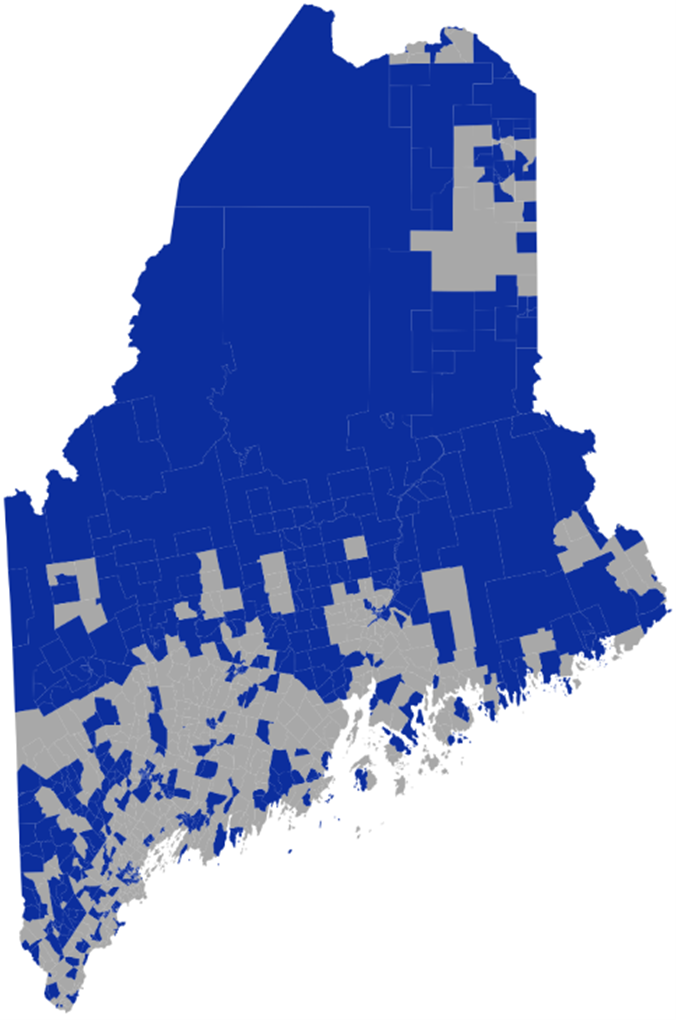
Figure 9: LID qualifying areas in Delaware: 2022 vs. 2023
2022: 48.9%
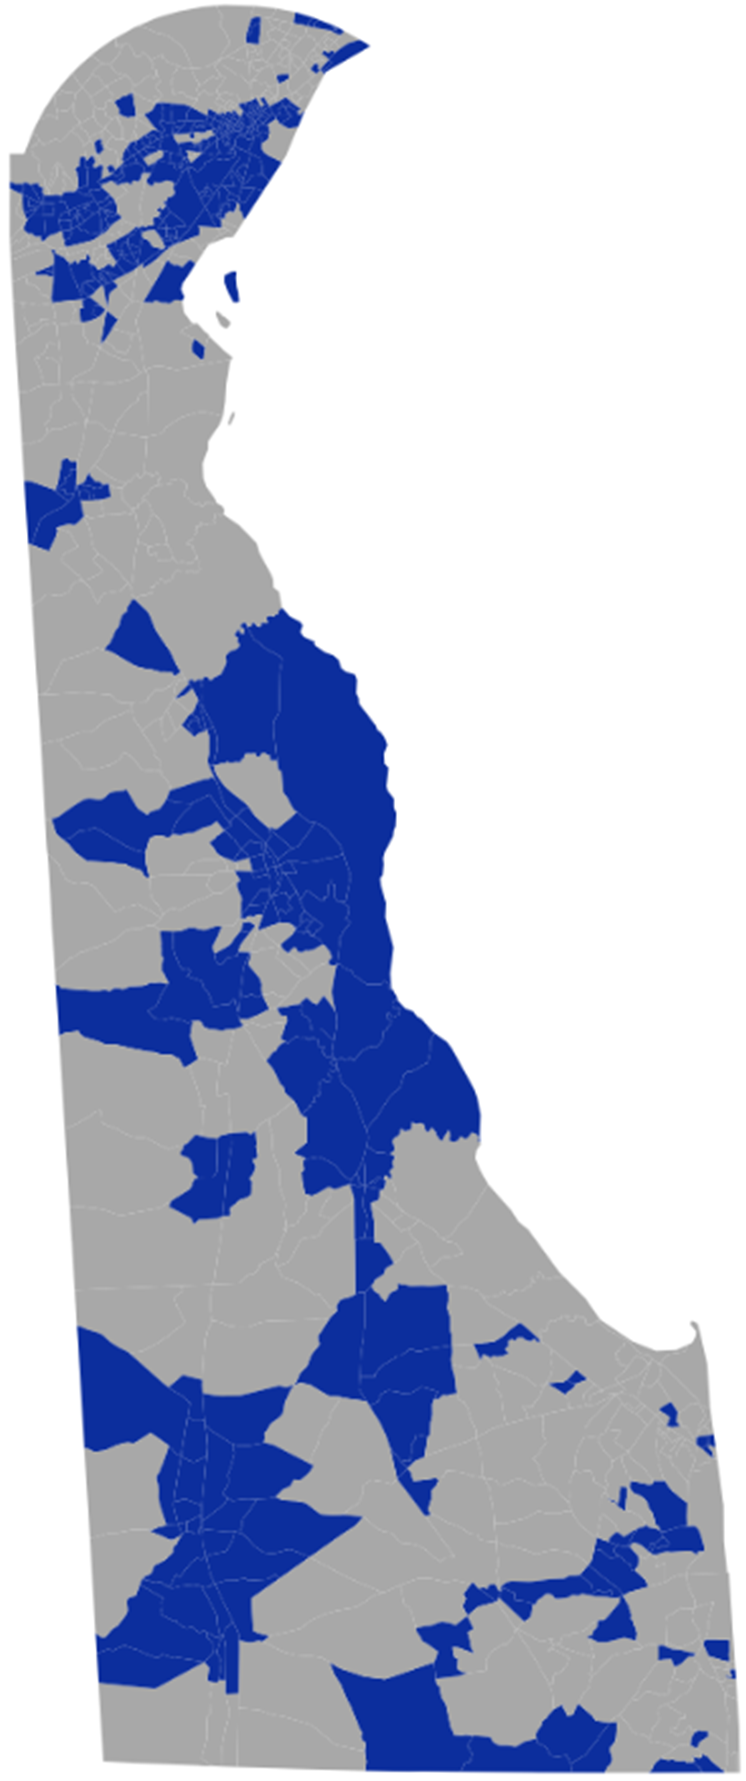
2023: 56.0%
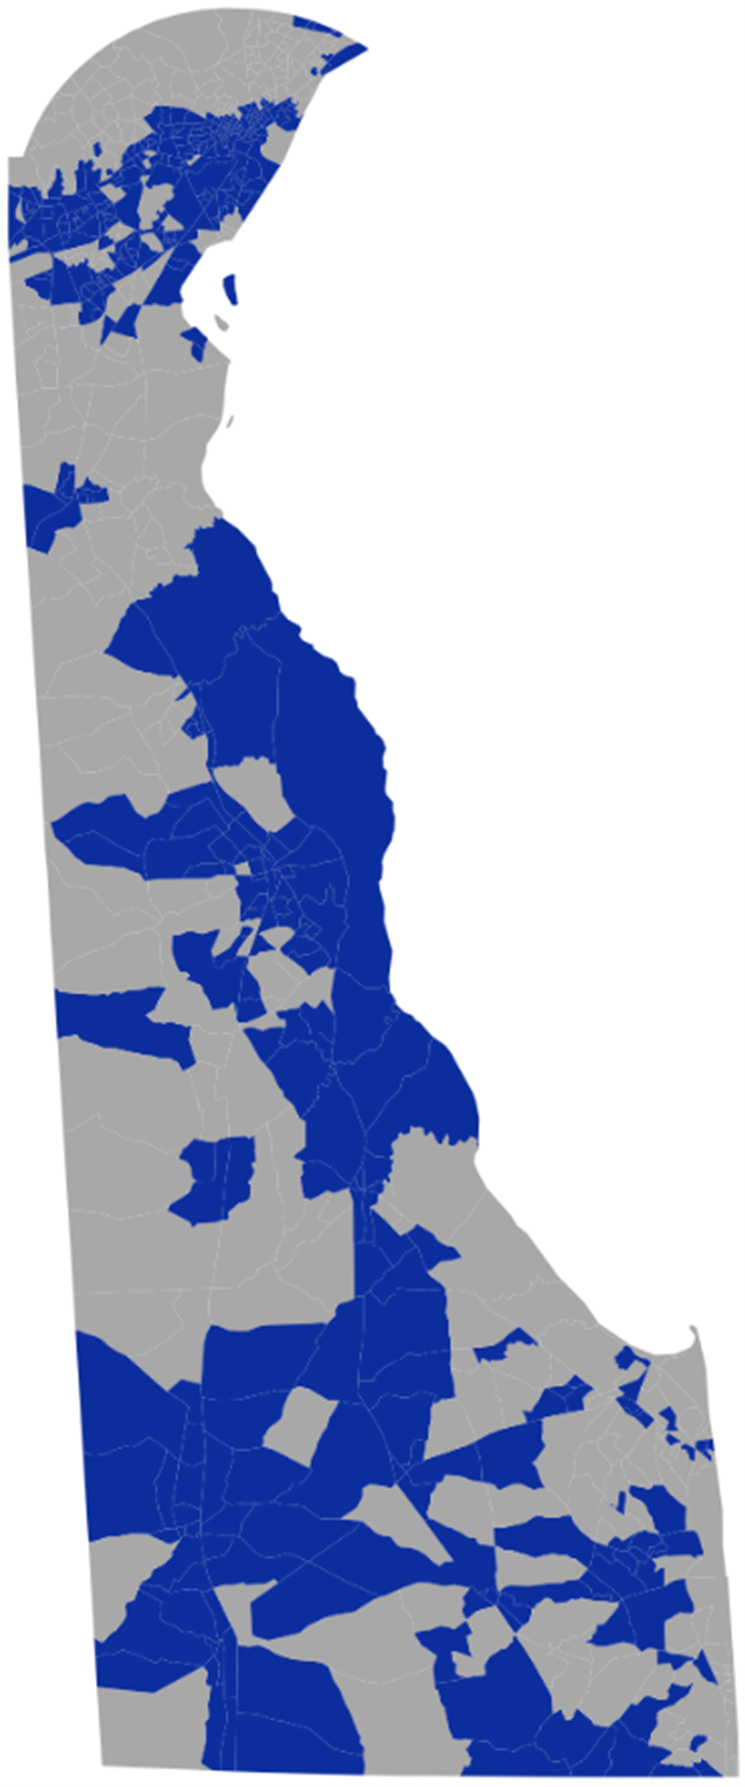
Figure 10: LID qualifying areas in Vermont: 2022 vs. 2023
2022: 40.3%
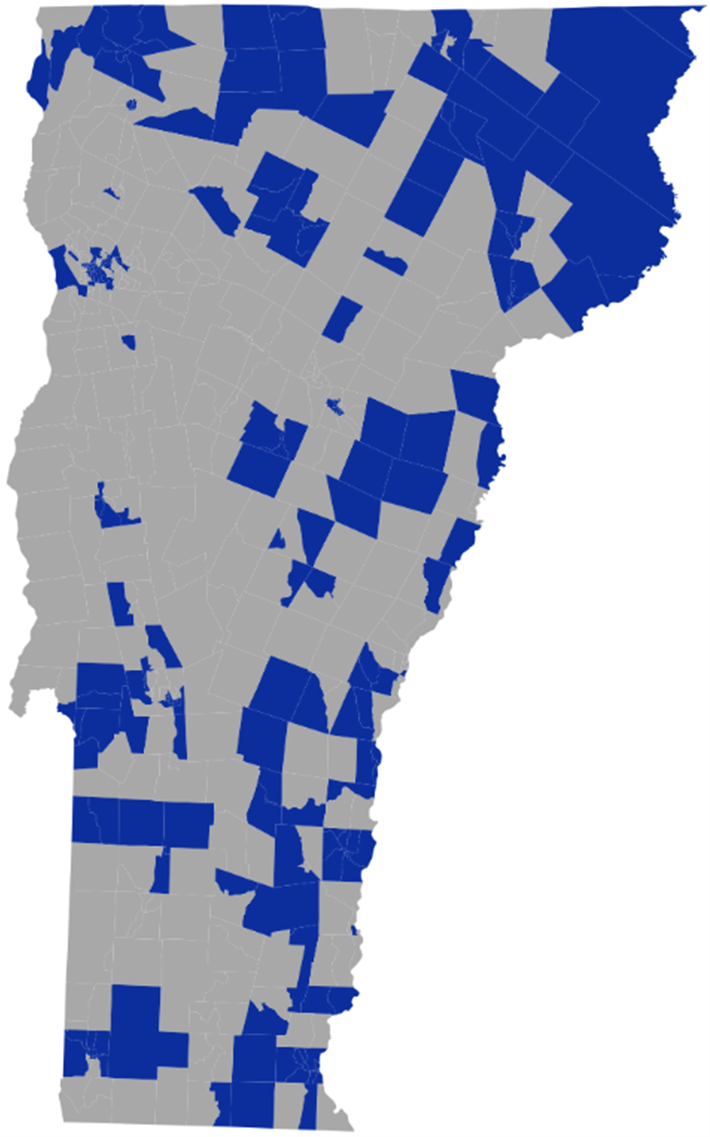
2023: 47.0%
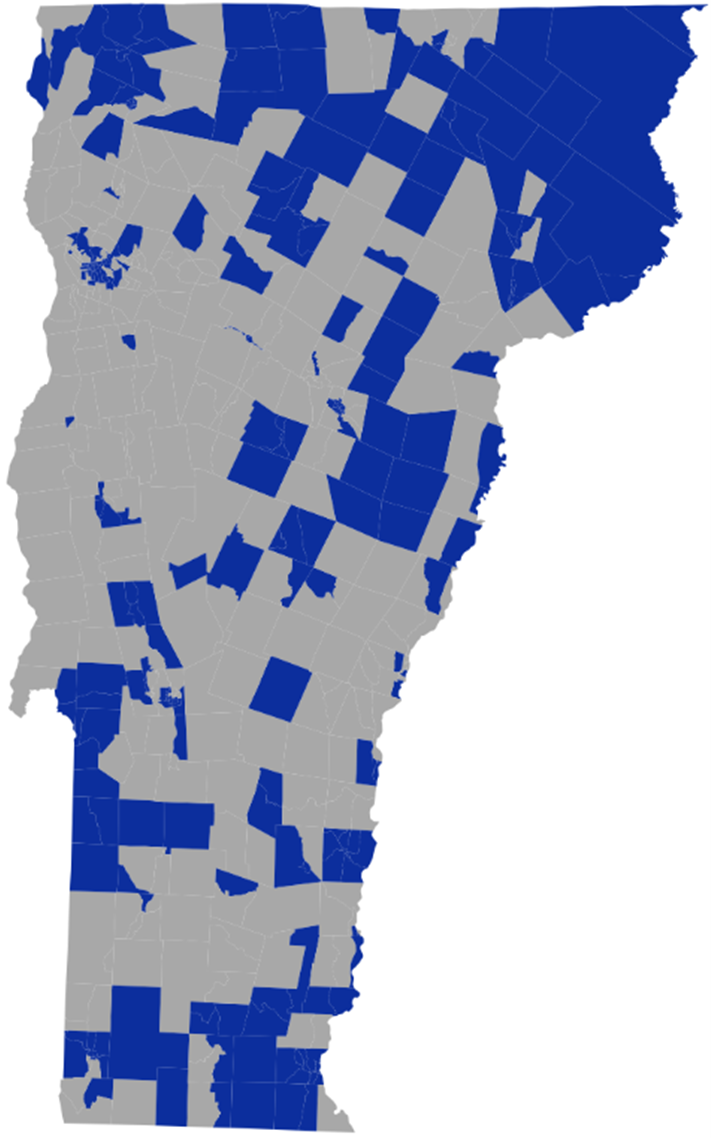
Figure 11: LID qualifying areas in Alaska: 2022 vs. 2023
2022: 42.9%
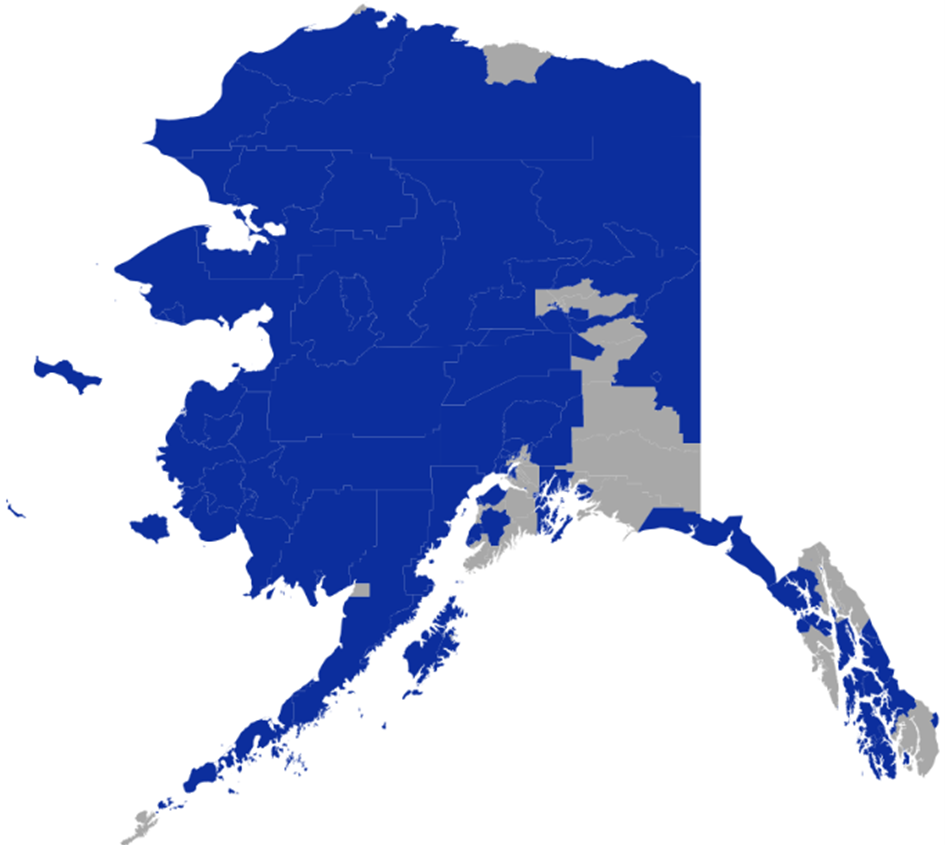
2023: 48.9%

How the Latest NCUA LID Workbook Update Affects County-Level Eligibility
Figure 12 presents the number of counties and populations thereof that experienced various levels of change in the fraction of their LID qualifying population. The figure shows, again, that the 2025 update of the NCUA LID Area Workbook generally identifies more areas as LID. Relatively few counties (424 or 13.1% of them) experienced declines in their fraction of LID qualifying areas. Moreover, counties that experienced falling fractions of LID qualifying areas were generally very small, accounting for an even smaller fraction of the U.S. population (4.4%).
Figure 12: Changes in LID qualifying areas, across counties, 2022-2023
A large majority of the U.S. population (69.2%) live in counties that saw either no or moderate changes in their fraction of LID qualifying areas (changing between 0% and 5%). In contrast, large fractions of the U.S. population (26.4%) live in counties that increased their fraction of LID qualifying population by at least 5%. However, while there were many counties (581 or 18% of them) that experienced somewhat large increases in their LID qualifying populations (i.e., of more than 10%), these counties were generally small, accounting for only 5.5% of U.S. population.
Next, Figures 13-17 present five larger counties that saw large changes (both increases and decreases) in their LID qualifying population with, in each case, changes larger than 50,000 residents and more than 15% of the county’s population.
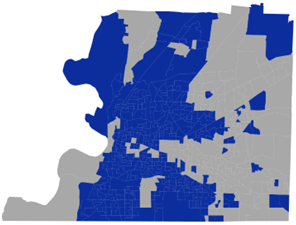
Figure 13: Erie County, Pennsylvania: 76,029 fewer LID qualifying residents (-28.2%)
2022: 100%
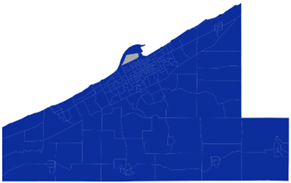
2023: 71.8%
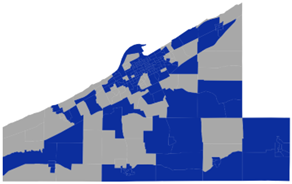
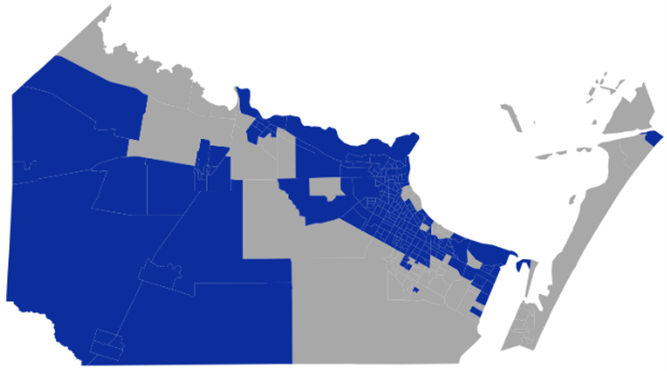
Figure 14: Bay County, Florida: 52,295 fewer LID qualifying residents (-28.8%)
2022: 100%
2023: 71.2%
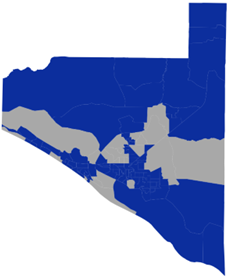
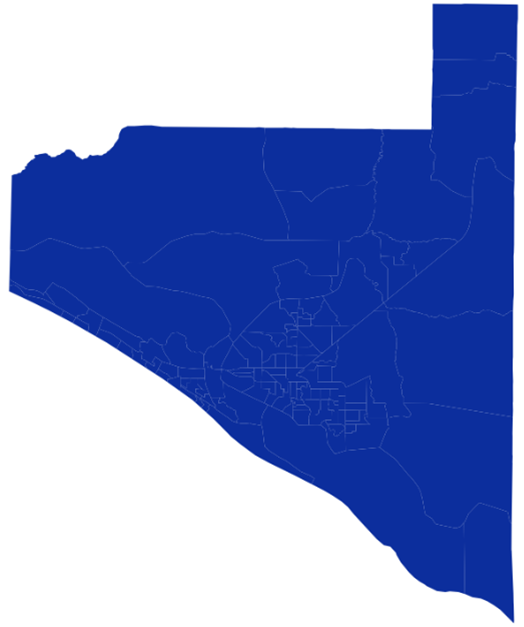
Figure 15: Luzerne County, Pennsylvania: 116,583 more LID qualifying residents (+35.8%)
2022: 74.2%
2023: 100%
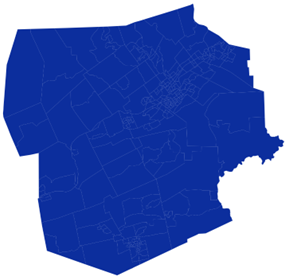
Figure 16: Nueces County, Texas: 119,761 more LID qualifying residents (+33.9%)
2022: 66.1%
2023: 100%
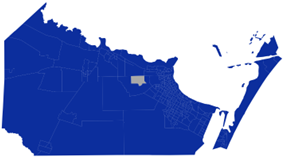
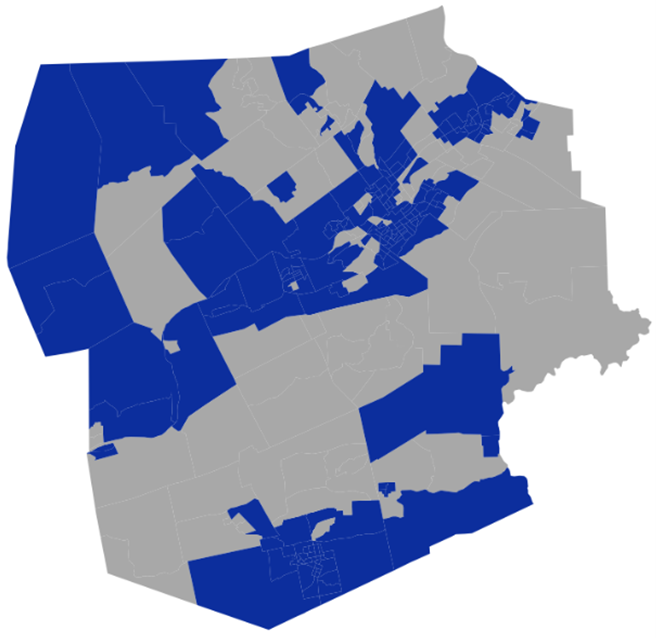
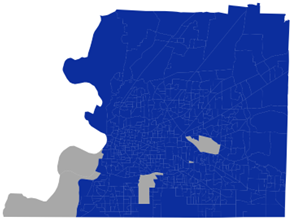
Figure 17: Shelby County, Tennessee: 331,501 more LID qualifying residents (+35.9%)
2022: 64.1%
2023: 100%
How We Can Help
CUCollaborate has experts in obtaining and maintaining low-Income designation, in field of membership (FOM) expansion, and in branch market selection. With our expertise, we can help your credit union navigate your low income designation journey, evaluate whether changes in NCUA LID Area workbooks affect you, and adjust your service network and marketing focus to better fit your LID goals. Our mission is to empower credit unions with the insights and tools they need to better serve their members and communities—and to help them compete more effectively in today’s financial landscape.
📅 Click here to schedule time with our team of LID experts.