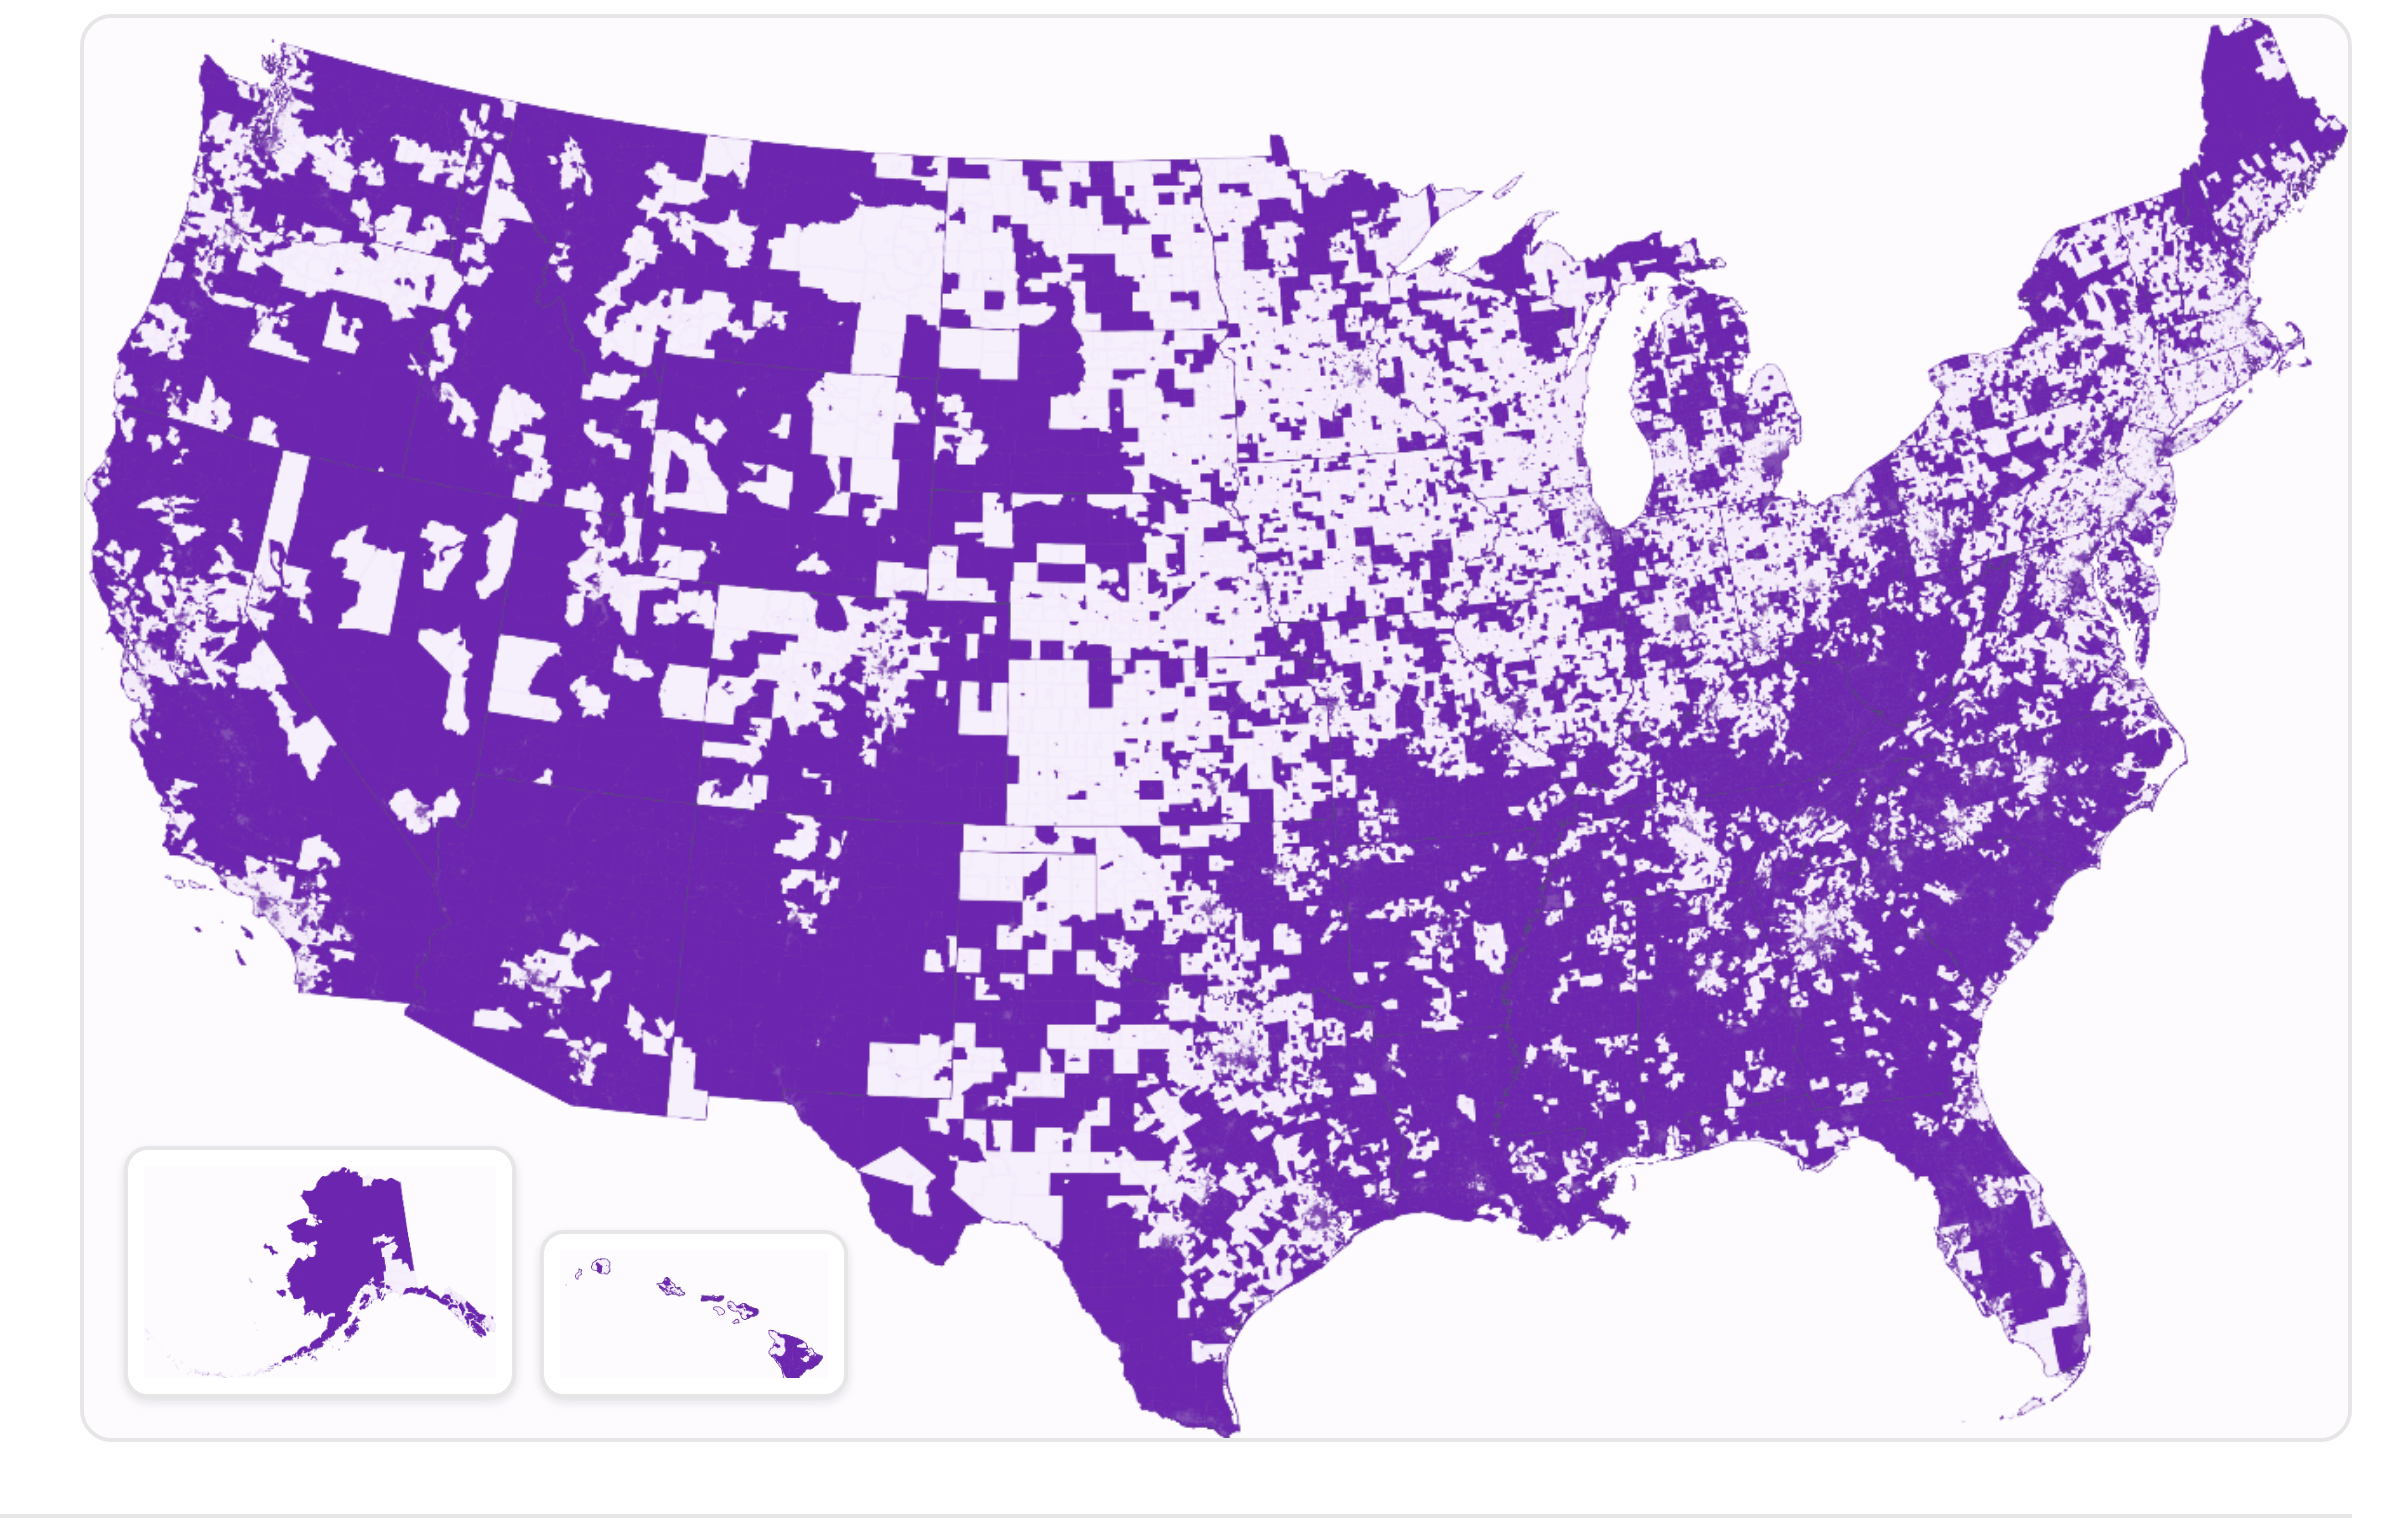
The latest NCUA LID Area Workbook increases the share of the U.S. population living in LID-qualifying geographies to 62.19%, opening new opportunities for credit unions to qualify for the low-income designation and its benefits. Credit unions should review their updated results, especially if they are near the 50% threshold.
Why the Low-Income Designation Matters
Credit unions serve the financial needs of members and communities of all incomes. The NCUA has regulations to identify some credit unions as low-income designated (LID) and provide several benefits (i.e., regulatory relief and funding) for LID credit unions. These benefits provide further incentives for credit unions to serve lower-income members and communities.
The benefits of being a LID credit union include:
1. An exemption from the statutory cap on member business lending, which expands access to capital for small businesses and helps credit unions to diversify their loan portfolios.
2. Ability to accept non-member deposits from any source (i.e., in addition to deposits from government organizations). The ability to accept non-member deposits can be particularly useful during mergers with credit unions and banks where all members and clients of the merging institutions do not readily fall within the field of membership of the continuing institution.
3. Authority to obtain secondary capital (i.e., subordinated debt). Additional capital can both buttress financial solidity and accommodate larger deposit inflows and/or loan growth.
4. Eligibility for grants and low-interest loans from the NCUA's Community Development Revolving Loan Fund (CDRLF), particularly for smaller institutions.
5. Special field of membership provisions for federal community and multiple common bond credit unions.
How to Read the NCUA LID Workbook
The main way a credit union can obtain and maintain its LID status is by showing that more than 50% of its members live in a LID-qualifying geography.
The NCUA identifies LID-qualifying geographies as counties, census tracts, and block groups whose residents’ incomes fall below specified benchmarks. The determination is relative, which is how there can be low-income-qualifying geographies in areas associated with very high incomes as well as very low incomes. To help credit unions assess whether they qualify for a low-income designation, the NCUA maintains, and updates, a Low-Income Designated Area Workbook that lists qualifying geographies.
A member counts towards LID if they qualify at any level: county, census tract, or census block group. For example, take Member A, whose house is in block group 010010201001, in Autauga County, Alabama.
Checking each level:
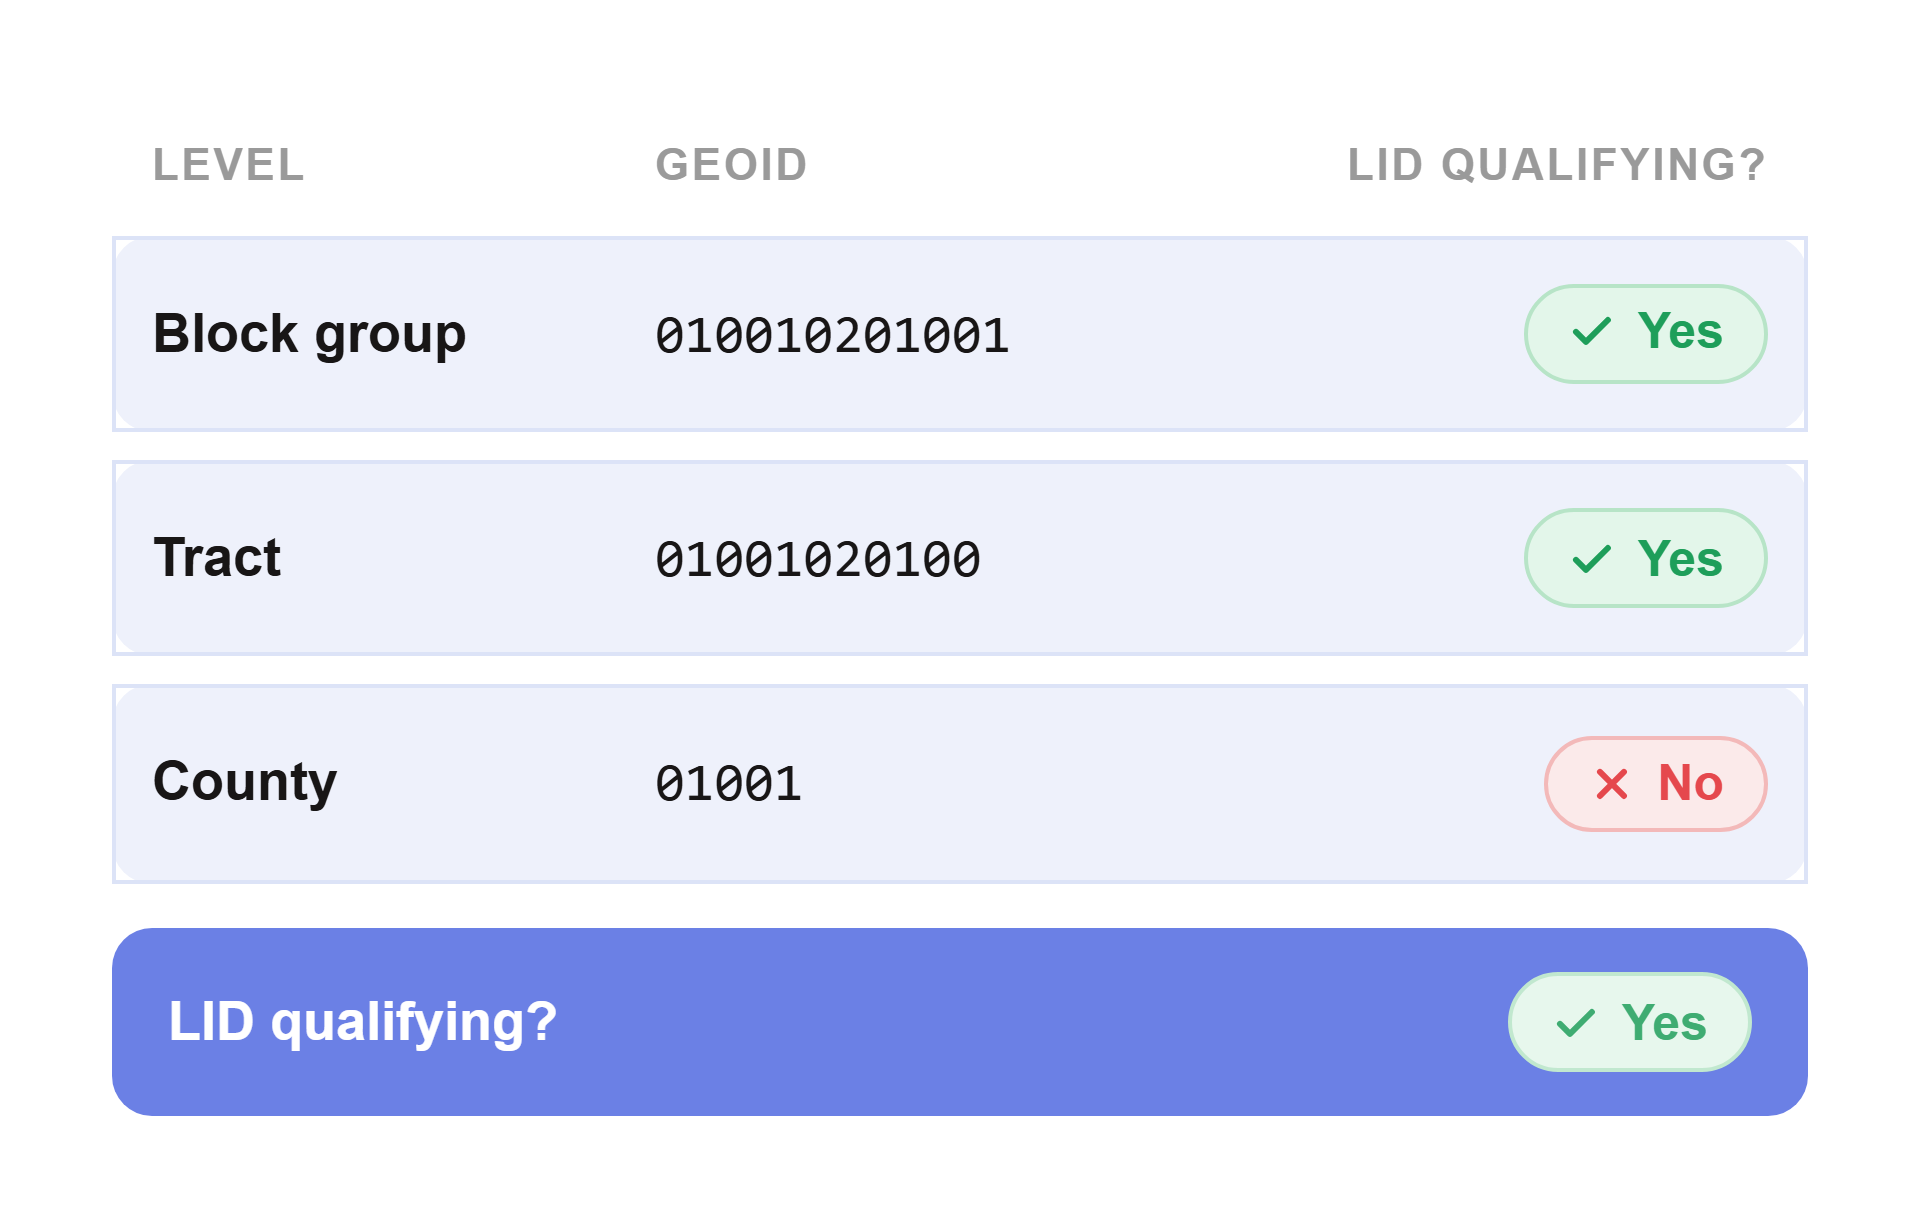
Since Member A qualifies at one or more levels (here, the block group and tract), they count toward their credit union's LID total.
The National Picture: 3.9 Million More People in LID-Qualifying Areas
NCUA's most recent LID Area Workbook, released in 2026, draws on the U.S. Census Bureau's 2024 American Community Survey (ACS) 5-year data, updating the 2025 workbook that used 2023 ACS data.
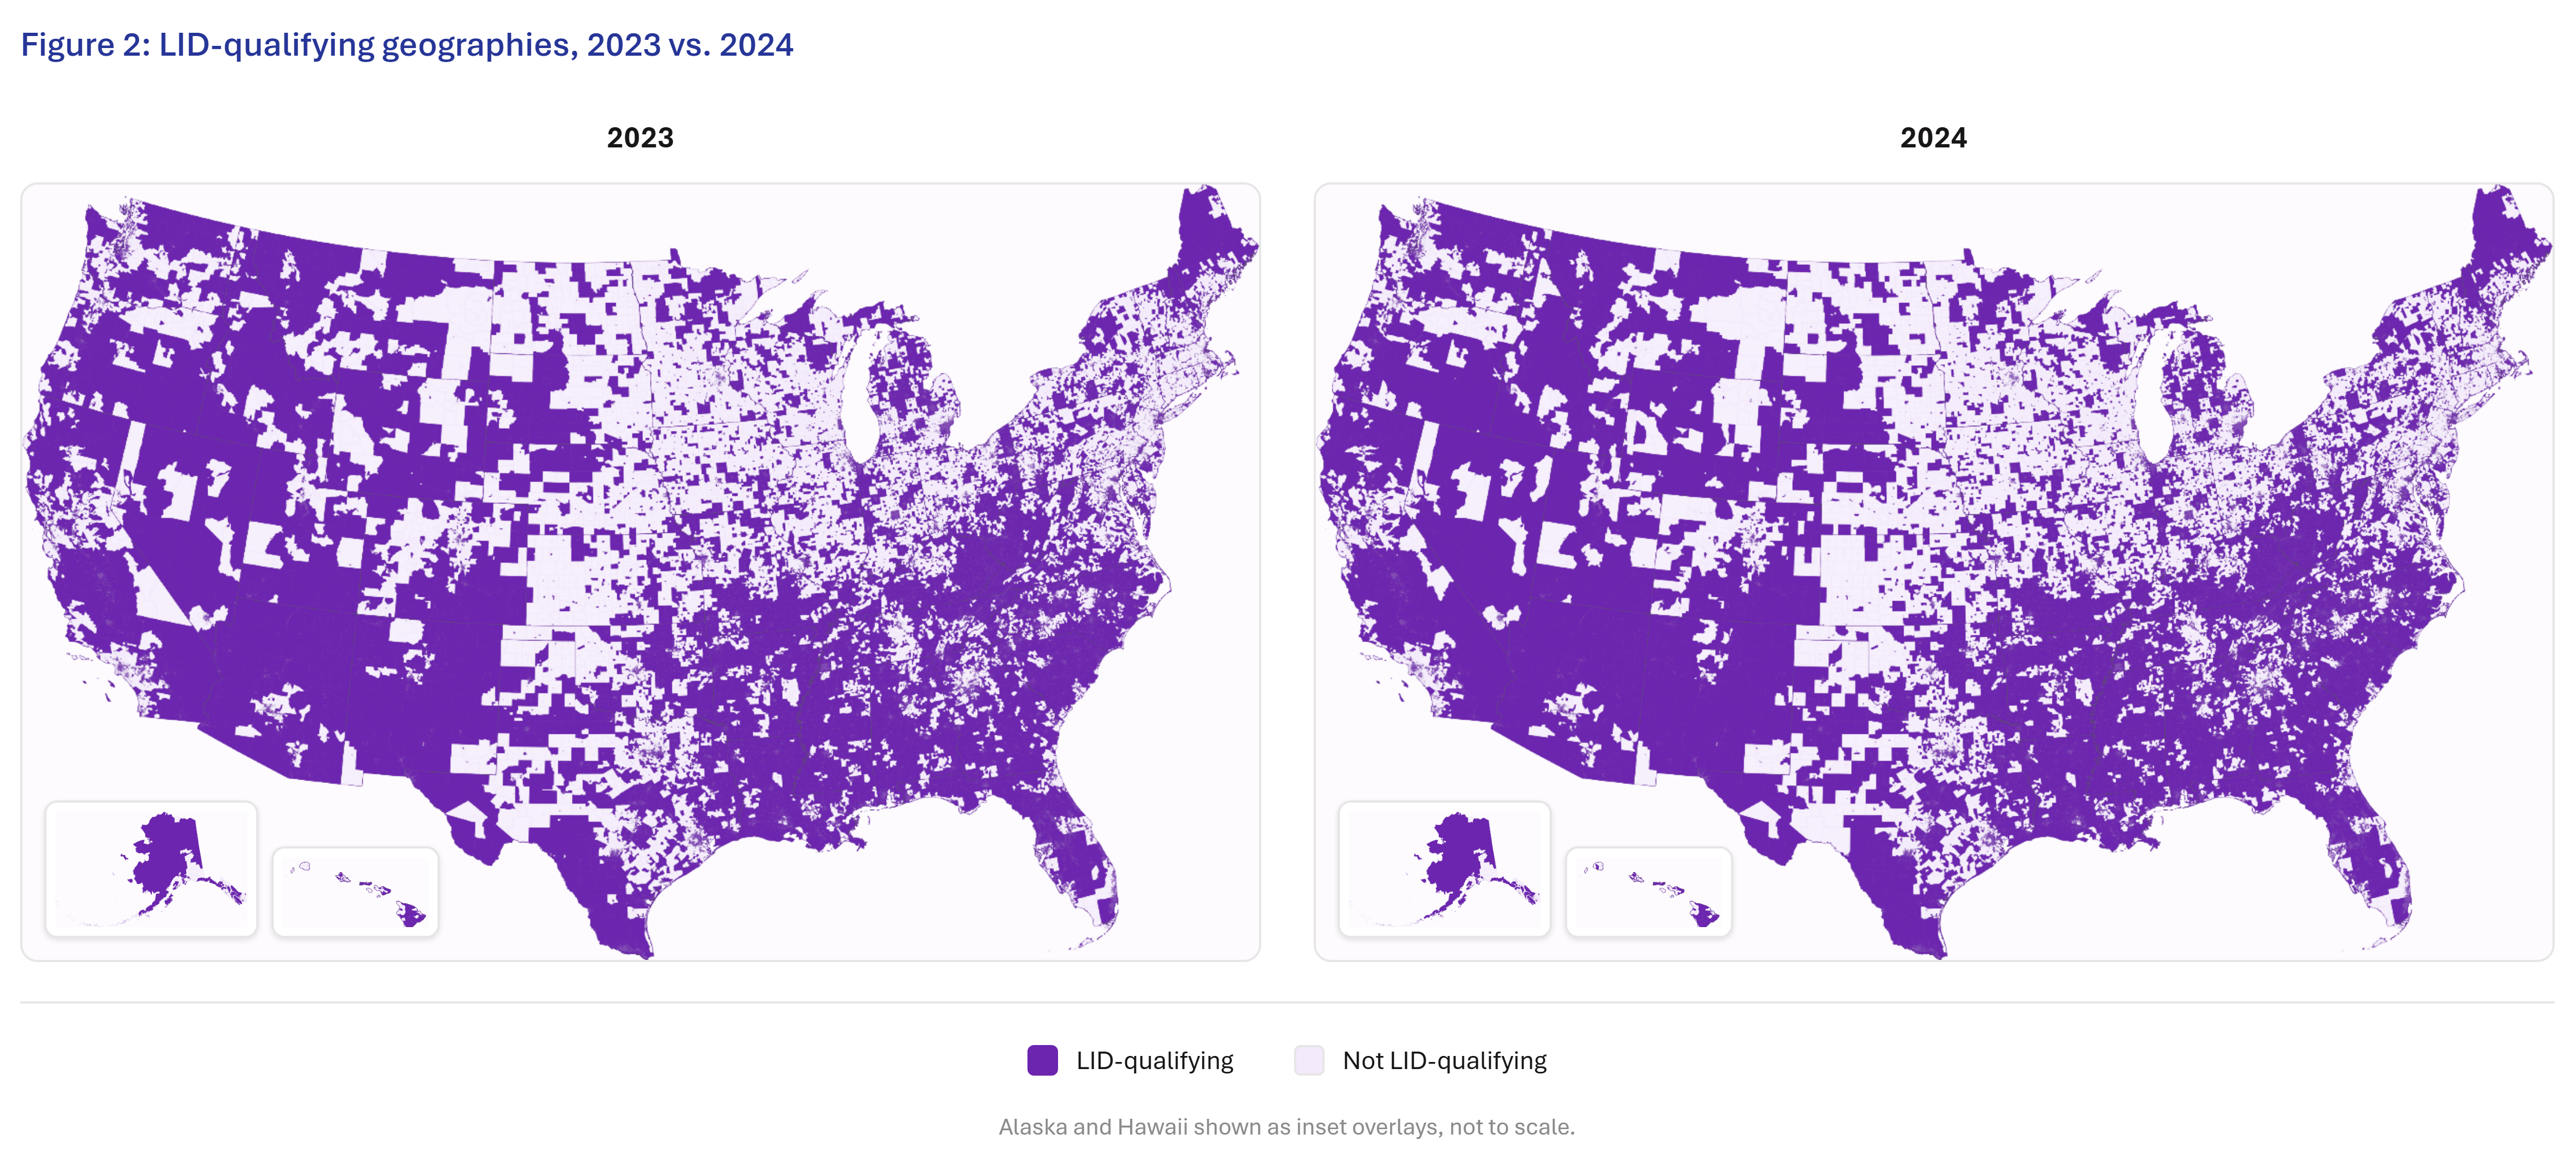
From 2023 to 2024, the number of US residents in LID-qualifying geographies increased across all three geographic units, corresponding to increases in the overall LID percentage nationwide. The percentage of the US population in LID-qualifying areas increased by over 3.9 million people, from 61.46% to 62.19% of the nation’s population. Reference Figure 1 for additional details.
Seen on the map, the growth is incremental rather than dramatic: the footprint of LID-qualifying areas in 2024 looks much like 2023, with modest gains. Figure 2 shows the two years side by side.
State by State: Where LID Is Easiest to Reach
Credit unions can seek or maintain LID more readily in parts of the country with more LID-qualifying areas.
LID-qualifying shares run highest across the South, Appalachia, and Puerto Rico. : The five highest jurisdictions in 2024 are:
- Puerto Rico (100%)
- West Virginia (85%)
- Louisiana (82%)
- Mississippi (80%)
- Arkansas (78%)
They run lowest across the Upper Midwest, the Great Plains, and the Northeast. The five lowest are:
- Connecticut (41%)
- North Dakota (44%)
- Nebraska (46%)
- Minnesota (47%)
- South Dakota (47%)
From 2023 to 2024, the LID-qualifying share rose in the majority of jurisdictions, with the biggest gains in:
- Delaware (+2.71%)
- Wyoming (+2.48%)
- Maine (+2.44%)
- South Carolina (+2.40%)
- Massachusetts (+2.06%)
Maine and the District of Columbia each crossed the 50% line, tipping from minority-LID to majority-LID. Only three states declined - Connecticut (-0.93%), the largest drop by far, and Alabama and Idaho (each -0.03%) - while Puerto Rico and New Mexico held essentially flat (0.00%).
County by County: Small Populations, Big Swings
Figure 6 presents the number of counties that experienced various levels of change in the fraction of their LID-qualifying population. About 36% of counties (1,154) saw no change, and another 24% (784) rose modestly, by less than 5%. About 8% of counties (249) increased by 10% or more. Declines were less frequent and mostly small: 546 counties (about 17%) slipped by less than 5%, and 268 counties (about 8%) dropped by 5% or more.
County-level changes can look more dramatic than state-level changes, and for a simple reason: county populations are much smaller, so in these instances, a relatively small increase in the count of LID-qualifying residents can move a county's percentage a long way.
Figure 7 shows the counties with the largest increases in their LID-qualifying percentage - led by Borden County, TX, which went from 0% to 100% LID-qualifying on an increase of just 713 residents. Figure 8 shows the largest decreases, which follow the same pattern in reverse: small counties such as Keya Paha County, NE swung from fully LID-qualifying to not qualifying at all.
The largest swings in the number of LID-qualifying residents, by contrast, tend to land in big metropolitan counties. Figure 9 shows the counties that gained the most LID-qualifying residents, led by Richland County, SC (+131,968, to 100% qualifying) and Hampshire County, MA (+102,579). Figure 10 shows those that lost the most, led by Luzerne County, PA (-100,517) and Connecticut's Naugatuck Valley Planning Region (-51,050).
The takeaway: the biggest shifts in percentage don't always reflect big shifts in population. In counties with small populations, a shift involving only a few hundred residents can produce a dramatic percentage swing. In larger counties, tens of thousands of residents may change qualification without necessarily producing an equally dramatic change in the rate.
What the New Workbook Means for Your Credit Union
The new workbook means your LID percentage may have shifted. Understanding high-level shifts is helpful as a starting point, but it's important to understand the full picture of your data - especially if your field of membership covers large geographies that cross multiple counties and states.
A new workbook may also instigate a cure notice from the NCUA as it reviews credit unions' data. If you receive one, don't panic: a cure notice gives you five years to return to compliance, and you keep your low-income designation for that entire period.
Even with that time buffer, we recommend regular monitoring of your data so that you can be proactive instead of reactive, especially if the benefits of LID are key to your credit union's strategic plan. Basically, it's easier to make a little change over a long period of time than a big change over a short period of time (that also may come with the threat of losing key benefits).
How CUCollaborate Can Help
The good news: CUCollaborate can help with this. With our expertise, we can help you navigate your LID journey. We'll help you analyze your data, understand potential impacts of the LID workbook changes, and identify opportunities and strategies to improve your LID percentage. The more you understand your data, the easier it is for your credit union to make data-driven decisions.
Our mission is to empower credit unions with the insights and tools they need to better serve their members and communities - and to help them compete more effectively in today's financial landscape.
Curious how the new LID workbook changes the picture for your credit union? Don't miss our upcoming webinar where we will dive into this analysis or if you can't wait, you can schedule a call with our team!