Layer 1 of 6
Is the easy deposit growth still coming?
No. Deposits are up 41.6% over ten years and 1.4% over five.
The surge came in 2020 and 2021. Deposits peaked in 2022 and sit 2.8% below that peak today. Branches fell 17.4% over the decade, from 91,834 to 75,859.
National deposits inside the $500M office cap, June of each year, $T
6.3
6.6
6.8
7.0
8.0
8.8
9.2
8.8
8.7
8.8
9.0
20162017201820192020202120222023202420252026
So what: show your board both starting years. From 2016 no large metro is down. From 2021, 64 of the 200 are.
Layer 2 of 6
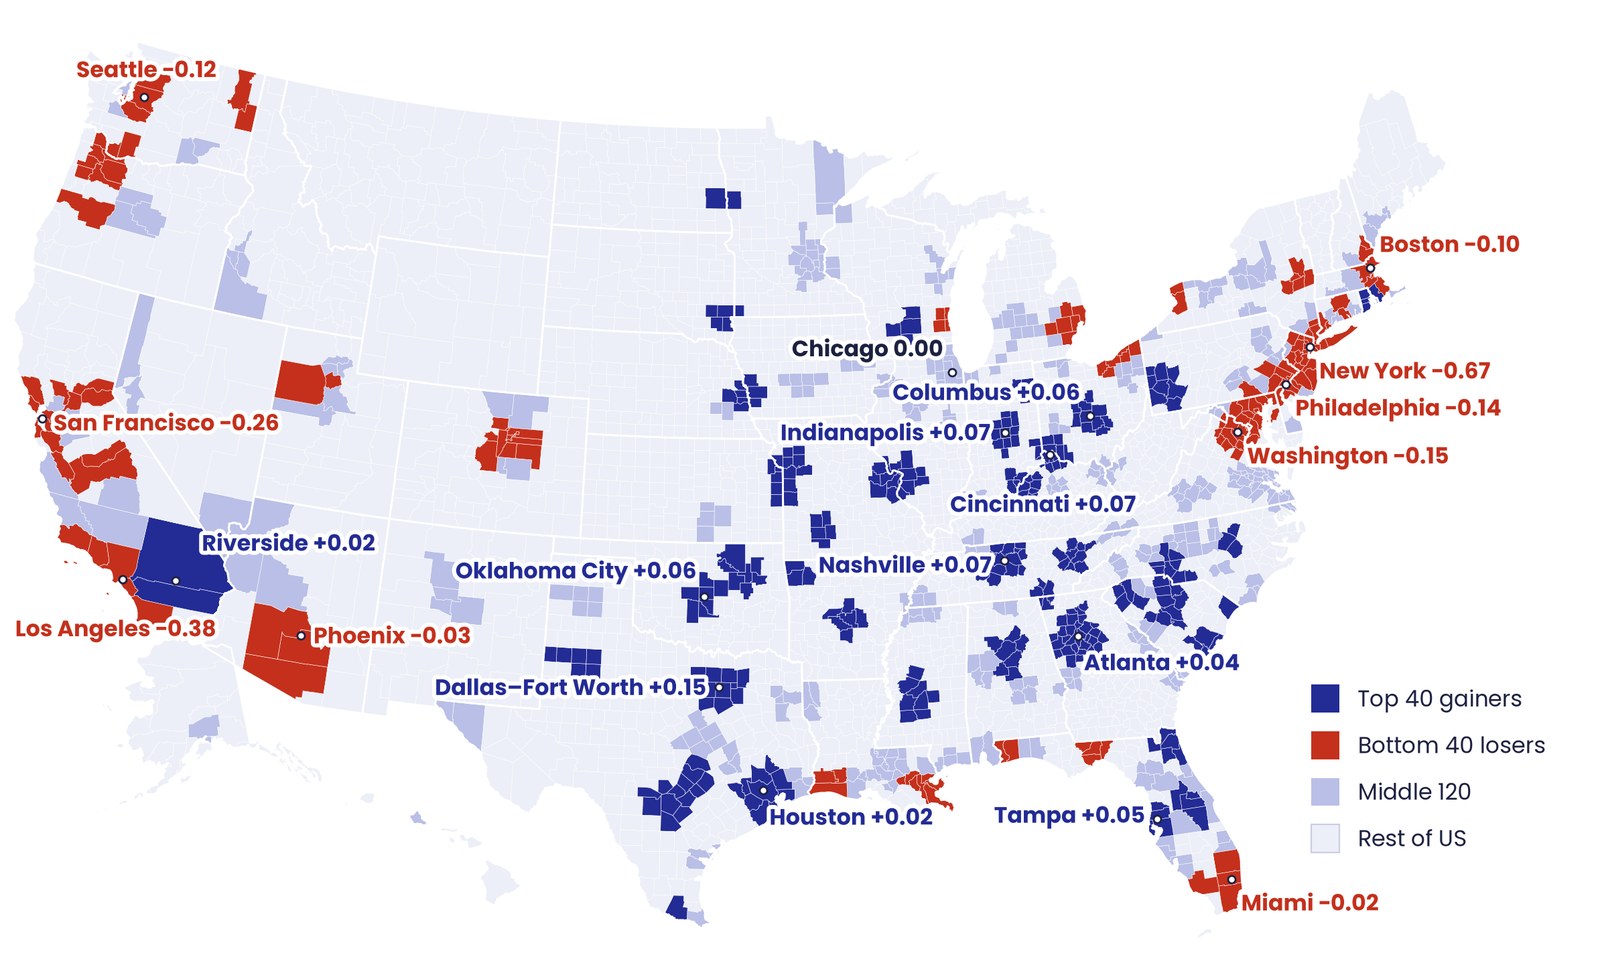
So where did the growth go?
To places with room, where new households keep arriving.
Rank the 200 large metros by deposit share gained since 2021. The top 40 grew households 8.1%. The bottom 40 grew them 3.4%. Household growth is the one signal that holds in every region.
Median five-year deposit growth inside the cap, 2021 to 2026, by density third of the 200 large metros
Least dense third+6.6%
Middle third+4.2%
Densest third−1.3%
So what: dense urban cores are a retention problem. Eleven of the 13 metros above 8,000 people per square mile lost deposits.
Florida shows the gap. It added 900,000 households in five years, second to Texas, yet ranks 16th among states in deposit share gained and lost 257 bank branches.
Layer 3 of 6
Who are those households?
Suburban families, not wealthy professionals. And they are multiplying faster than the population.
Children are 21.6% of residents in the 40 gaining metros against 20.0% in the 40 losing ones. Average household income is lower in the gainers, $117K against $137K. Age is not the driver.
United States, 2021 to 2026
+5.4%Households, 127.6M to 134.4M
+3.2%People, 332.9M to 343.5M
So what: size markets in households, not residents. In 627 counties households grew while population fell.
Layer 4 of 6
Are the gaining markets underserved?
Not necessarily. Most gainers are not thin on branches, and most losers are.
Underbanked means 1,400 or more households per branch, counting banks and credit unions. 103 of the 200 large metros are underbanked. Riverside is thinnest of the gainers at 2,589 households per branch.
Underbanked metros, by deposit share gained 2021 to 2026
40 that gained the most share17 of 40
120 in the middle59 of 120
40 that lost the most share27 of 40
So what: the 17 gainers that are also underbanked pair household growth with thin coverage. Start there.
Layer 5 of 6
What does a branch that works look like?
A new branch books a median $6.7M in year one and $37M in year five, and it does best near a retail cluster.
Of 10,699 branches opened since July 2016, 11.2% were already gone by the 2026 filing. The retail cluster effect holds after controlling for market type, households, income, opening year and state.
Median year-five deposits of new full-service branches, by distance to the nearest retail cluster
No cluster nearby$20Mn 453
Cluster within the Fed radius$37Mn 5,304
Cluster next door$39Mn 3,474
So what: screen every site on three tests: a retail cluster in reach, enough households in reach, and predicted year-five deposits. The Fed radius is 2 miles urban, 5 suburban, 10 rural. This is association, not proof.
Layer 6 of 6
What about the places that cannot carry a branch?
Serve them another way. Only 1 of 3,625 banking deserts clears the bar an ordinary new branch clears.
A banking desert is a tract with no bank or credit union branch within the Fed radius. The Fed counts 3,635 of them, home to 4.43M households, and 3,625 match our block group data. Federal help has not reached the suburban ones: 1.4% received New Markets Tax Credit investment, against 9.0% of rural deserts.
Share with a retail cluster within the Fed radius
New bank branches since 201695%
Credit union sites95%
Banking deserts15%
So what: price shared branching, ATMs, mobile service and digital enrollment against a branch before you commit capital. Our reading by type, untested: digital for the urban edge, shared branching and assisted enrollment for suburban, mobile and local partners for rural.
The recap
- The easy growth is over. +41.6% in ten years, +1.4% in five.
- It moved to places with room and arriving households.
- Those households are suburban families. Count households, not people.
- Gaining share is not thin coverage. Test every market at 1,400 households per branch.
- A good site sits near retail. Year-five deposits of $37M, $20M without a cluster.
- Serve the rest another way. Almost no desert can pay for a branch.
Which markets are you weighing next? Name two or three and we will size each one in households, show the households in reach and test the site.